Classification
of data using decision tree [C50] and regression tree [rpart] methods
Tasks
covered:
Introduction
to data classification and decision trees
Read
csv data files into R
Decision
tree classification with C50
Decision
[regression] tree classification with rpart [R implementation of
CART]
Visualization
of decision trees
Data
classification and decision trees
Data classification is a machine
learning methodology that helps assign known class labels to unknown
data. This methodology is a supervised learning
technique that uses a training dataset labeled with known class
labels. The classification method develops a classification model [a
decision tree in this example exercise] using information from the
training data and a class purity algorithm. The resulting model can be
used to assign a known class to new unknown data.
A decision tree is the specific
model output of the two data classification techniques covered in this
exercise. A decision tree is a graphical representation of a rule set
that results in some conclusion, in this case, a classification of an
input data item. A principal advantage of decision trees is that they
are easy to explain and use. The rules of a decision tree follow a
basic format. The tree starts at a root node [usually placed at the
top of the tree]. Each node of the tree represents a rule whose result
splits the options into several branches. As the tree is traversed
downward a final leaf node is finally reached. This leaf node
determines the class assigned to the data. This process could also be
accomplished using a simple rule set [and most decision tree methods
can output a rule set] but, as stated above, the graphical tree
representation tends to be easier to explain to a decision maker.
This exercise will introduce and
experiment with two decision tree classification methods: C5.0 and
rpart.
C50
C50 is an R implementation of the
supervised machine learning algorithm C5.0 that can generate a
decision tree. The original algorithm was developed by Ross Quinlan.
It is an improved version of C4.5, which is based on ID3. This algorithm uses an information entropy
computation to determine the best rule that splits the data, at that
node, into purer classes by minimizing the computed entropy value.
This means that as each node splits the data, based on the rule at
that node, each subset of data split by the rule will contain less
diversity of classes and will, eventually, contain only one class
[complete purity]. This process is simple to compute and therefore C50
runs quickly. C50 is robust. It can work with both numeric or
categorical data [this example shows both types]. It can also tolerate
missing data values. The output from the R implementation can be
either a decision tree or a rule set. The output model can be used to
assign [predict] a class to new unclassified data items.
The R function rpart is an
implementation of the CART [Classification and Regression Tree] supervised machine learning
algorithm used to generate a decision tree. CART was developed by Leo
Breiman, J. H. Friedman, R. A. Olshen, and C. J. Stone. CART is a
trademarked name of a particular software implementation. The R
implementation is called rpart for Recursive PARTitioning.
Like
C50, rpart uses a computational metric to determine
the best rule that splits the data, at that node, into purer
classes. In the rpart algorithm the computational metric is the Gini coefficient. At each node,
rpart minimizes the Gini coefficient and thus splits the data into purer
class subsets with the class leaf nodes at the bottom of the decision
tree. The process is simple to compute and runs fairly well, but our
example will highlight some computational issues. The
output from the R implementation is a decision tree that can be used
to assign [predict] a class to new unclassified data items.
The
datasets
This
example uses three datasets [in csv format]: Iris, Wine, and Titanic.
All three of these datasets are good examples to use with classification
algorithms. Both Iris and Wine are comprised of numeric data. Titanic is
entirely categorical data. All three datasets have one attribute that
can be designated as the class variable [Iris -> Classification (3
values), Wine -> Class (3 values), Titanic -> Survived (2
values)]. The Wine dataset introduces some potential computational
complexity because it has 14 variables.This complexity is a good test of
the performance of the two methods used in this exercise. The
descriptive statistics and charting of these datasets is left as an
additional exercise for interested readers.
Description
of the Titanic dataset: this file is a modified subset of the Kaggle
Titanic dataset. This version contains four categorical
attributes: Class, Age, Sex, and Survived]. Like the two datasets above,
it was downloaded from the UCI Machine Learning Repository. That dataset
no longer exists in that repository because of the existence of the
richer Kaggle version.
The
classification exercise - C50
This
exercise demonstrates decision tree classification, first using C50 and
then using rpart. Because the two methods use different purity metrics
and computational steps, it will compare and contrast the output of the
two methods.
The
C50 exercise begins by loading the package and reading in the file
Iris_Data.csv.
#
get the C5.0 package
install.packages('C50')
library('C50')
# load the package
ir
<- read.csv('Iris_Data.csv') # open iris dataset
The exercise looks at some
descriptive statistics and charts for the iris data. This can help
understand what potential patterns are found in the dataset. While
these tests are not explicitly included in the script for the other
datasets, an interested reader can adapt the commands and repeat the
descriptive analysis for themselves.
#
summary, boxplot, pairs plot
summary(ir)
boxplot(ir[-5],
main = 'Boxplot of Iris data by attributes')
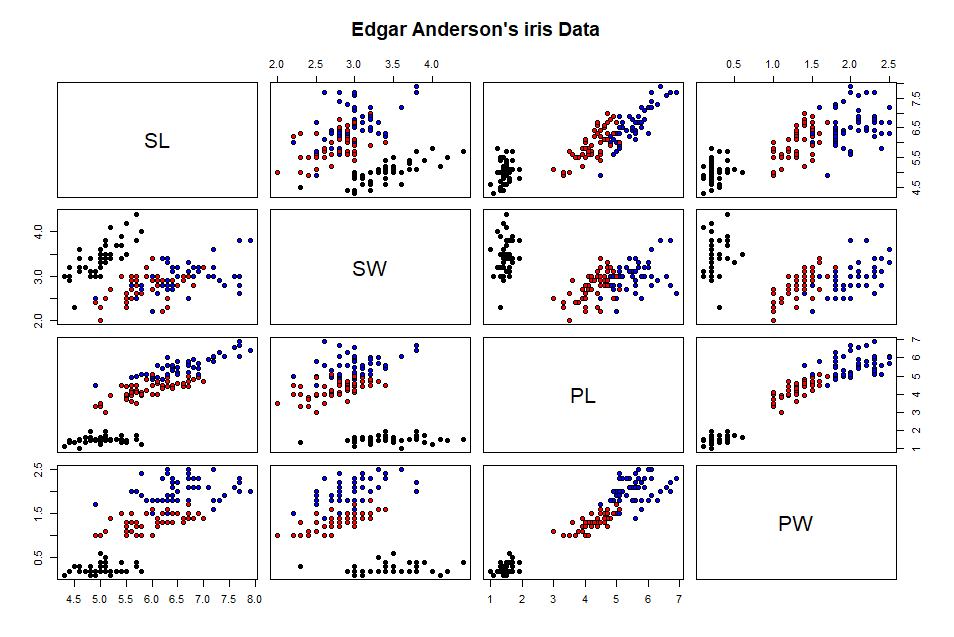
pairs(ir[,-5],
main="Edgar Anderson's iris Data", pch=21, bg = c("black", "red",
"blue")[unclass(ir$Classification)])
The summary statistics provide
context to the planned classification task. There are three labels in
the Classification
attribute. These are the target classes for our decision tree. The
pairs plot [shown below] is helpful. The colors represent the three
iris classes. The black dots [Setosa instances] appear to be well
separated for the other dots. the other two groups [red and blue dots]
are not as well separated.
The function c5.0(
) trains the decision
tree model.
irTree
<- C5.0(ir[,-5], ir[,5])
This is the minimal set of input
arguments for this function. The first argument [the four flower
measurement attributes, minus the Classification attribute] identifies
the data that will be used to compute the information entropy and
determine the classification splits. The second argument [the
Classification attribute] identifies the class labels. The next two
commands view the model output
summary(irTree)
# view the model components
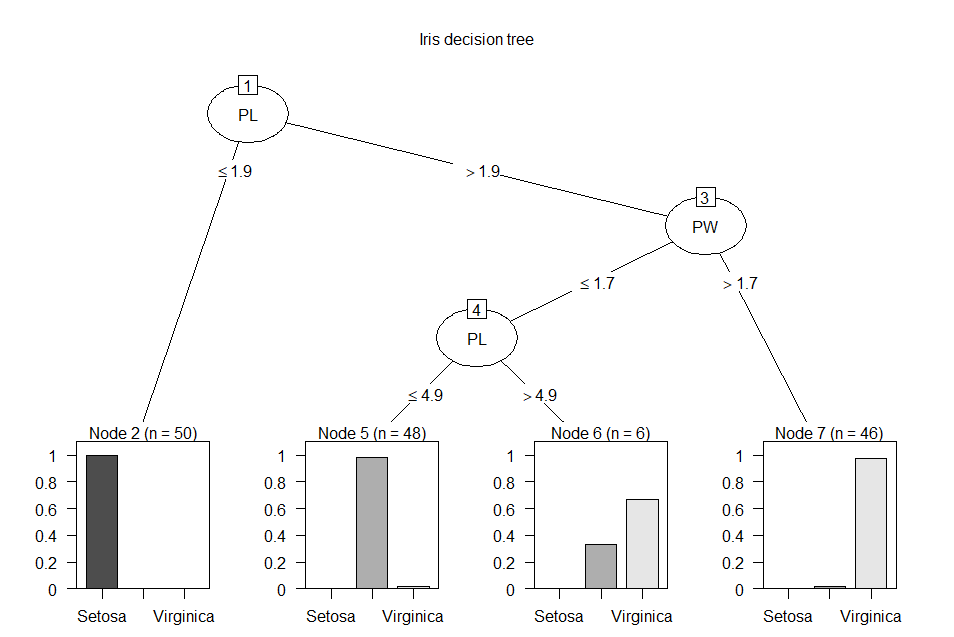
plot(irTree,
main = 'Iris decision tree') # view the model graphically
The summary( ) function is a C50
package version of the standard R library function. This version
displays the C5.0 model output in three sections. The first section is
the summary header. It states the function call, the class
specification, and states how many data instances were in the training
dataset. the second section displays a text version of the decision
tree.
PL
<= 1.9: Setosa (50)
PL
> 1.9:
:...PW
> 1.7: Virginica (46/1)
PW <= 1.7:
:...PL <= 4.9: Versicolor (48/1)
PL > 4.9: Virginica (6/2)
The first two output lines show a
split based on the PL attribute at the value 1.9. Less than or equal
to that value branches to a leaf node containing 50 instances of
Setosa items. If PL is greater than 1.9, the tree branches to a node
that splits based on the PW attribute at the value 1.7. Greater than
1.7 branches to a leaf node containing 46 instances of Virginica items
and one item that is not Virginica. If PW is less than or equal to
1.7, the tree branches to a node that splits based on the PL attribute
at the value 4.9. Less than or equal to that value
branches to a leaf node containing 48 instances of Versicolor items
and one item that is not Veriscolor. If PL is greater than 4.9, the
tree branches to a node 6 instances of Virginica items and
2 items that are not Virginica. The third section of the summary( )
output shows the analysis of the classification quality based on the
training data classification with this decision tree model.
Evaluation
on training data (150 cases):
Decision
Tree
----------------
Size Errors
4
4( 2.7%) <<
(a) (b) (c) <-classified
as
---- ---- ----
50
(a): class Setosa
47 3 (b): class Versicolor
1 49 (c): class Virginica
Attribute usage:
100.00% PL
66.67% PW
This output shows that the
decision tree has 4 leaf [classification] nodes and, using the
training data, resulted in four items being mis-classified [assigned a
class that does not match its actual class]. Below those results is a
matrix showing the test classification results. Each row represents
the number of data instances having a known class label [1st row (a) =
Setosa, 2nd row (b) = Versicolor, 3rd row (c) = Virginica]. Each
column indicated the number of data instances classified under a given
label [(a) = Setosa, (b) = Versicolor, (c) = Virginica]. All 50 Setosa
data instances were classified correctly. 47 Versicolor data instances
were classified as Versicolor and 3 were classified as Virginica. 1
Virginica data instance was classified as Versicolor and 49 were
classified correctly. Only two of the four flower measurement
attributes [PL and PW] were used in the decision tree. Here is a
graphical plot of the decision tree produced by the plot(
) function included
in the C50 package [this function overloads the base plot(
) function for C50
tree objects]
plot(irTree,
main = 'Iris decision tree') # view the model graphically
This decision tree chart depicts
the same information as the text-based tree shown above, but it is
visually more appealing. Each of the split nodes and the splitting
criterion is easily understood. The classification results are
represented as percentiles, with the total number of data instances in
each leaf node listed at the top of the node. this chart shows why
decision trees are easy to understand. The output from C50 can be
represented by a rule set instead of a decision tree. This is helpful
if the model results are intended to be converted into programming
code in another computer language. Explicit rules are easier to
convert versus the tree split criterion.
#
build a rules set
irRules
<- C5.0(ir[,-5], ir[,5], rules = TRUE)
summary(irRules)
# view the ruleset
The c5.0(
) function is
modified with an additional argument [rules
= TRUE]. This changes
the model output from a decision tree to a decision rule set. The
summary output of the rule set is similar to the summary output from
the decision tree except that the text-based decision tree is replaced
by a rule set.
Rules:
Rule
1: (50, lift 2.9)
PL <= 1.9
-> class Setosa [0.981]
Rule
2: (48/1, lift 2.9)
PL > 1.9
PL <= 4.9
PW <= 1.7
-> class Versicolor [0.960]
Rule
3: (46/1, lift 2.9)
PW > 1.7
-> class Virginica [0.958]
Rule
4: (46/2, lift 2.8)
PL > 4.9
-> class Virginica [0.938]
Default
class: Setosa
The rule set corresponds to the
decision tree leaf nodes [one rule per leaf node], but a careful
review of the rules reveals that the some rules are different than the
decision tree branches [Rule 3 for example]. The rules are applied in
order. Any data items not classified by the first rule are tested by
the second rule. This process proceeds through each rule. Any data
items that pass through all of the rules without being classified are
trapped by the final default rule. The strength of each rule is
indicated by the number next to the class label. The lift metric is a
measure of the performance of the rule at predicting the class [larger
lift = better performance]. This is included to trap data that does
not conform to the domain of the original training data set.
Before moving on to the next data
set, this exercise provides and example of how to use the predict( )
function in this package. Unknown data can be classified using the
trained tree model in the function predict(
). The exercise uses
all of the iris dataset in this example instead of actual unclassified
data. While being artificial, it allows the example to walk through a
procedure that matches the new classifications to the actual
classifications. After labeling the data with predicted classes, the
prediction data set is compared to the actual set and the
mis-classified instanced are found. This section is left as an
exercise for the interested reader to explore.
The next section of the example
computes a C5.0 decision tree and rule set model for the Wine dataset.
This dataset is interesting because it consists of 13 numeric
attributes representing the chemical and physical properties of the
wine and a class attribute which is used as the target classes for the
classification model.
wine
<- read.csv('Wine.csv') # read the dataset
head(wine) # look at the 1st 6 rows
wTree <- C5.0(wine[,-14],
as.factor(wine[,14])) # train the tree
The command head(wine)shows that the 14 attributes of
the Wine dataset are all numeric. This means that the Class attribute
must be defined as a factor in C5.0 so that it can be the target
classes for the decision tree. C5.0 runs quickly and has no difficulty
computing the information entropy and discovering the best split
points. Here is the summary output and final decision tree:
summary(wTree)
# view the model components
Decision
tree:
Flavanoids
<= 1.57:
:...Color.intensity
<= 3.8: 2 (13)
:
Color.intensity > 3.8: 3 (49/1)s
Flavanoids
> 1.57:
:...Proline
<= 720: 2 (54/1)
:
Proline > 720:
:...Color.intensity <= 3.4: 2 (4)
: Color.intensity > 3.4: 1 (58)
Evaluation
on training data (178 cases):
Decision Tree
----------------
Size Errors
5 2
(1.1%) <<
(a) (b) (c) <-classified as
---- ---- ----
58
1 (a): class 1
70 1 (b): class
2
48 (c): class 3
Attribute
usage:
100.00%
Flavanoids
69.66% Color.intensity
65.17% Proline
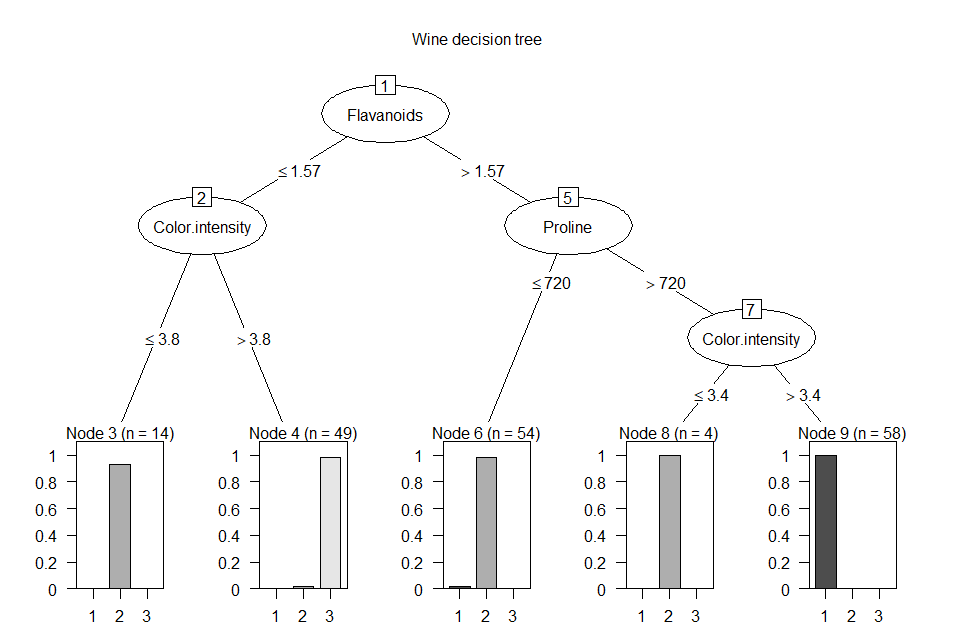
plot(wTree,
main = 'Wine decision tree') # view the model graphically
Notice that C5.0 only uses three
of the 14 attributes in the decision tree. These three
attributes provide enough information to split the dataset into refines
class subsets at each tree node. Here is the C5.0 rule set:
wRules
<- C5.0(wine[,-14], as.factor(wine[,14]), rules = TRUE)
summary(wRules)
# view the ruleset
Rules:
Rule
1: (58, lift 3.0)
Flavanoids > 1.57
Color.intensity > 3.4
Proline > 720
-> class 1 [0.983]
Rule
2: (55, lift 2.5)
Color.intensity <= 3.4
-> class 2 [0.982]
Rule
3: (54/1, lift 2.4)
Flavanoids > 1.57
Proline <= 720
-> class 2 [0.964]
Rule
4: (13, lift 2.3)
Flavanoids <= 1.57
Color.intensity <= 3.8
-> class 2 [0.933]
Rule
5: (49/1, lift 3.6)
Flavanoids <= 1.57
Color.intensity > 3.8
-> class 3 [0.961]
Default
class: 2
Attribute
usage:
97.75% Flavanoids
92.13% Color.intensity
62.92% Proline
These rules resemble the split
conditions in the decision tree and the same subset of three
attributes are used in the rule set as in the decision tree, but the
attribute usage percentages are different for the rule set versus the
decision tree. This result is a result of the sequential application
of the rules versus the split criterion applied in a decision tree.
The third example uses the Titanic
dataset. As stated above, this dataset consists of 2201 rows and four
categorical attributes [Class, Age, Sex, and Survived].
tn
<- read.csv('Titanic.csv') # load the dataset into an object
head(tn)
# view the first six rows of the dataset
Train a decision tree and view the
results
tnTree
<- C5.0(tn[,-4], tn[,4])
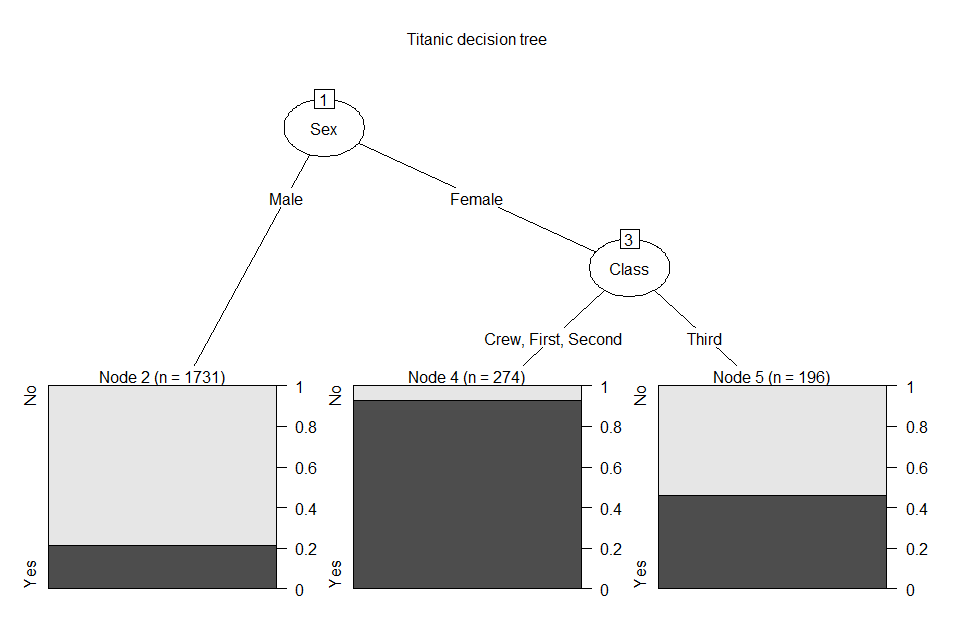
plot(tnTree,
main = 'Titanic decision tree') #view the tree
This decision tree uses only two
tests for its classifications. The final leaf nodes look different
than the two tree above. Since there are only two classes [Survived =
Yes, No], the leaf nodes show the proportions for each class within
each node. Here is the summary for the decision tree:
summary(tnTree)
# view the tree object
Decision
tree:
Sex
= Male: No (1731/367)
Sex
= Female:
:...Class
in {Crew,First,Second}: Yes (274/20)
: Class = Third: No (196/90)
Evaluation
on training data (2201 cases):
Decision Tree
----------------
Size Errors
3 477 (21.7%)
<<
(a) (b) <-classified as
---- ----
1470 20 (a): class No
457 254 (b): class Yes
Attribute usage:
100.00% Sex
21.35% Class
Train a rule set for the dataset
and view the results
tnRules
<- C5.0(tn[,-4], tn[,4], rules = TRUE)
summary(tnRules)
# view the ruleset
Rules:
Rule
1: (1731/367, lift 1.2)
Sex = Male
-> class No [0.788]
Rule
2: (706/178, lift 1.1)
Class = Third
-> class No [0.747]
Rule
3: (274/20, lift 2.9)
Class in {Crew, First, Second}
Sex = Female
-> class Yes [0.924]
Default
class: No
Attribute
usage:
91.09% Sex
44.53% Class
The
classification exercise - rpart
The rpart( ) function trains a
classification regression decision tree using the Gini index as its
class purity metric. Since this algorithm is different from the
information entropy computation used in C5.0, it may compute different
splitting criterion for its decision trees. The rpart(
) function uses a
pre-specified regression function as its first argument. The format
for this function is: Class variable ~ input variable A + input
variable B + [any other input variables]. The examples in this
discussion will use all of the dataset attributes as input variables
and let rpart select the best ones for the decision tree model.
Additionally, the summary of an rpart decision tree object is very
different from the summary of a C5.0 decision tree object.
Here is the code for the first
example that trains a rpart regression decision tree with the iris
dataset
#
create a label for our formula
f
= ir$Classification ~ ir$SL + ir$SW + ir$PL + ir$PW
#
train the tree
irrTree
= rpart(f, method = 'class')
#
view the tree summary
summary(irrTree)
The first command defines the
regression formula f. All four measurement
attributes are used in the regression formula to predict the
Classification attribute. The second command trains a regression
classification tree using the formula f. The third command prints out
the summary of the regression tree object. Here is the output from summary(irrTree)
Call:
rpart(formula
= f, method = "class")
n= 150
CP nsplit rel error xerror
xstd
1
0.50 0 1.00
1.21 0.04836666
2
0.44 1 0.50 0.66
0.06079474
3
0.01 2
0.06 0.12 0.03322650
Variable
importance
ir$PW
ir$PL ir$SL ir$SW
34 31 21 13
Node
number 1: 150 observations, complexity param=0.5
predicted class=Setosa expected
loss=0.6666667 P(node) =1
class counts: 50 50 50
probabilities: 0.333 0.333 0.333
left son=2 (50 obs) right son=3 (100 obs)
Primary splits:
ir$PL < 2.45 to the left, improve=50.00000, (0 missing)
ir$PW < 0.8 to the left, improve=50.00000, (0 missing)
ir$SL < 5.45 to the left, improve=34.16405, (0 missing)
ir$SW < 3.35 to the right, improve=18.05556, (0 missing)
Surrogate splits:
ir$PW < 0.8 to the left, agree=1.000, adj=1.00, (0 split)
ir$SL < 5.45 to the left, agree=0.920, adj=0.76, (0 split)
ir$SW < 3.35 to the right, agree=0.827, adj=0.48, (0 split)
Node
number 2: 50 observations
predicted class=Setosa expected loss=0 P(node)
=0.3333333
class counts: 50 0 0
probabilities: 1.000 0.000 0.000
Node
number 3: 100 observations, complexity
param=0.44
predicted class=Versicolor expected loss=0.5 P(node)
=0.6666667
class counts: 0 50 50
probabilities: 0.000 0.500 0.500
left son=6 (54 obs) right son=7 (46 obs)
Primary splits:
ir$PW < 1.75 to the left, improve=38.969400, (0 missing)
ir$PL < 4.75 to the left, improve=37.353540, (0 missing)
ir$SL < 6.15 to the left, improve=10.686870, (0 missing)
ir$SW < 2.45 to the left, improve= 3.555556, (0 missing)
Surrogate splits:
ir$PL < 4.75 to the left, agree=0.91, adj=0.804, (0 split)
ir$SL < 6.15 to the left, agree=0.73, adj=0.413, (0 split)
ir$SW < 2.95 to the left, agree=0.67, adj=0.283, (0 split)
Node
number 6: 54 observations:
predicted class=Versicolor expected loss=0.09259259 P(node) =0.36
class counts: 0 49 5
probabilities: 0.000 0.907 0.093
Node
number 7: 46 observations
predicted class=Virginica expected loss=0.02173913 P(node)
=0.3066667
class counts: 0 1 45
probabilities: 0.000 0.022 0.978
This output provides the details
of how rpart( ) selects the attribute and value at each split point
[nodes 1 and 3]. Node 1 is the root node. There are 50 instances of
each class at this node. Four primary split choices and three
surrogate split choices are shown [best choice first]. The best split
criterion [ir$PL < 2.45] splits the data left to node 2 [50
instances of Setosa] and right to node 3 [100 instances of both
Versicolor and Virginica]. Note that the split criterion used by rpart
are different than the split criterion produced by C5.0. This
difference is due to the different splitting algorithm [information
entropy versus GINI] used by each method. Node 2 contains 50 instances
of Setosa. Since this node is one pure class, no additional split is
needed. Node 3 splits the data based on the best primary split choice
[ir$PW < 1.75] left to node 6 and right to node 7. This node
numbering is an unusual behavior of rpart( ) and, if this regression
tree went deeper, the node numbers would increase by jumps at each
deeper level. Node 6 contains 54 data instances, with 49 Versicolor
instances and 5 Virginica instances. Node 7 contains 46 instances, with
1 Versicolor instance and 45 Virginica instances.
A text version of the tree is
displayed using the command:
print(irrTree)
# view a text version of the tree
n=
150
node),
split, n, loss, yval, (yprob)
* denotes terminal node
1)
root 150 100 Setosa (0.33333333 0.33333333 0.33333333)
2) ir$PL< 2.45 50 0 Setosa (1.00000000 0.00000000 0.00000000) *
3) ir$PL>=2.45 100 50 Versicolor (0.00000000 0.50000000
0.50000000)
6) ir$PW< 1.75 54 5 Versicolor (0.00000000 0.90740741 0.09259259)
*
7) ir$PW>=1.75 46 1 Virginica (0.00000000 0.02173913 0.97826087)
*
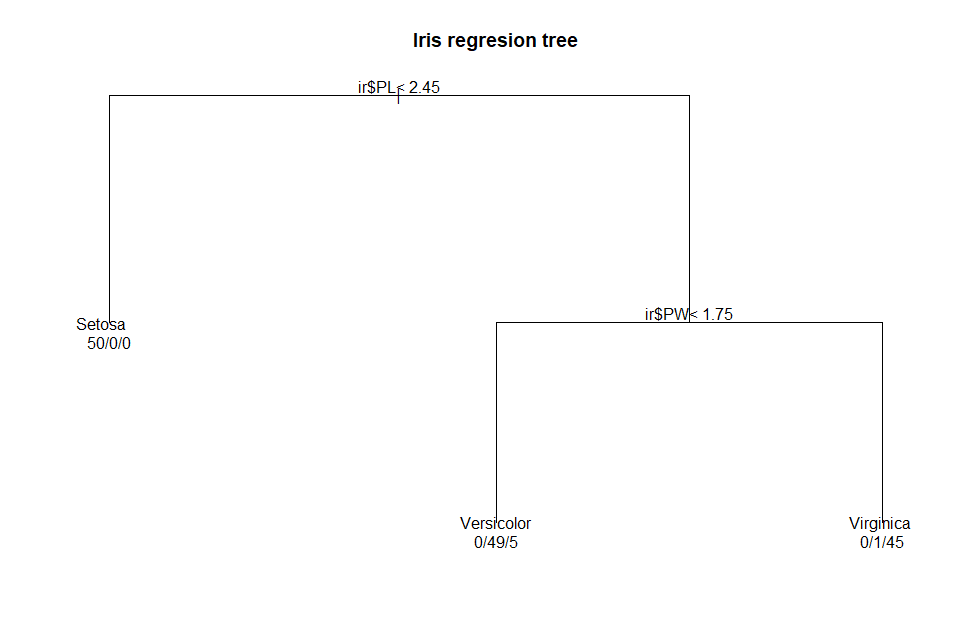
The plot(
) function included
in the rpart package is functional, but it produces a tree that is not
as visually appealing as the one included in C5.0. Three commands are
needed to plot the regression tree:
par(xpd
= TRUE) # define graphic parameter
plot(irrTree,
main = 'Iris regresion tree') # plot the tree
text(irrTree,
use.n = TRUE) # add text labels to tree
The plot(
) function draws the
tree and displays the chart title. The text(
) function adds the
node labels, indicating the split criterion at the interior nodes and
the classification results at the leaf nodes. Note that the leaf nodes
also show the counts of each actual class at the leaf nodes.
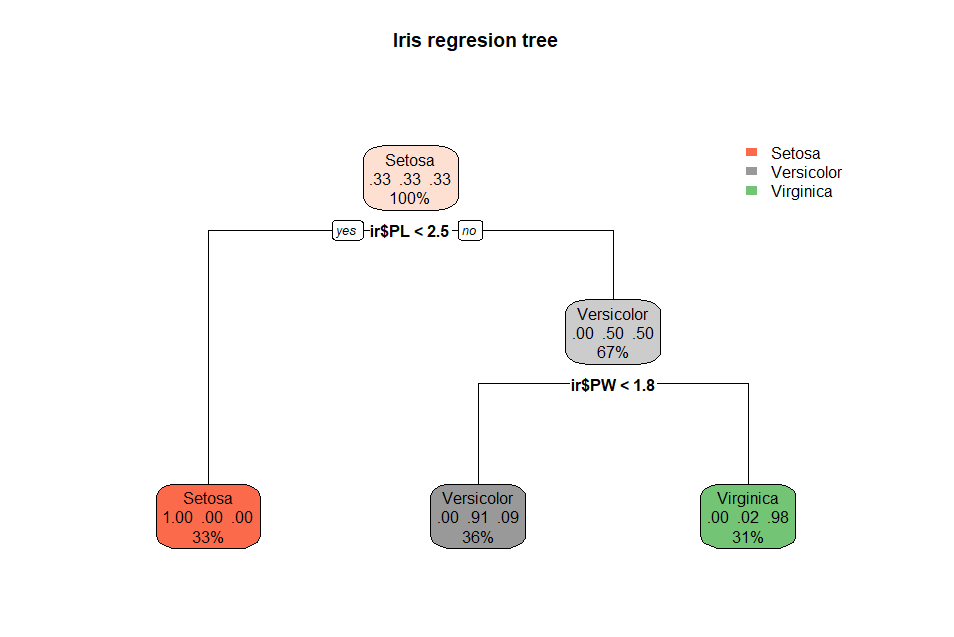
For
a more visually appealing regression tree the rpart.plot package can be
used. Here is the same iris regression tree using rpart.plot(
):
rpart.plot(irrTree,
main = 'Iris regresion tree') # a better tree plot
One
function draws this chart. The interior nodes are colored in a light
shade of the target class. The node shows the proportion of each class
at that node and the percentage of the dataset at that node. The leaf
nodes are colored based on the node class. The node shows the proportion
of each class at that node and the percentage of the correct class from
the dataset at that node. This display of percentages differs from the
class counts displayed by the rpart plot(
) function.
Here
is the second example of a rpart regression decision tree using the wine
dataset.
f
<- wine$Class ~ wine$Alcohol + wine$Malic.acid + wine$Ash +
wine$Alcalinity.of.ash + wine$Magnesium + wine$Total.phenols +
wine$Flavanoids + wine$Nonflavanoid.phenols + wine$Proanthocyanins +
wine$Color.intensity + wine$Hue + wine$OD280.OD315.of.diluted.wines +
wine$Proline
winerTree
= rpart(f, method = 'class') # train the tree
summary(winerTree)
# view the tree summary
The
first command defines the regression formula f. All
thirteen measurement attributes are used in the regression formula to
predict the class attribute. The second command trains a regression
classification tree using the formula f. The third command prints out
the summary of the regression tree object. Here is the output from summary(winerTree).
Call:
rpart(formula
= f, method = "class")
n= 178
CP nsplit rel error
xerror xstd
1
0.49532710 0 1.0000000 1.0000000
0.06105585
2
0.31775701 1 0.5046729 0.4859813
0.05670132
3
0.05607477 2 0.1869159 0.3364486
0.05008430
4
0.02803738 3 0.1308411 0.2056075
0.04103740
5
0.01000000 4 0.1028037 0.1588785
0.03664744
Variable
importance
wine$Flavanoids wine$OD280.OD315.of.diluted.wines
18
17
wine$Proline
wine$Alcohol
13
12
wine$Hue
wine$Color.intensity
10
9
wine$Total.phenols
wine$Proanthocyanins
8
7
wine$Alcalinity.of.ash
wine$Malic.acid
6
1
Node
number 1: 178 observations, complexity param=0.4953271
predicted class=2 expected loss=0.6011236 P(node) =1
class counts: 59 71 48
probabilities: 0.331 0.399 0.270
left son=2 (67 obs) right son=3 (111 obs)
Primary splits:
wine$Proline
< 755 to the right, improve=44.81780, (0 missing)
wine$Color.intensity
< 3.82 to the left, improve=43.48679, (0 missing)
wine$Alcohol
< 12.78 to the right, improve=40.45675, (0 missing)
wine$OD280.OD315.of.diluted.wines < 2.115 to the right,
improve=39.27074, (0 missing)
wine$Flavanoids
< 1.4 to the right, improve=39.21747, (0 missing)
Surrogate splits:
wine$Flavanoids
< 2.31 to the right, agree=0.831, adj=0.552, (0 split)
wine$Total.phenols
< 2.335 to the right, agree=0.781, adj=0.418, (0 split)
wine$Alcohol
< 12.975 to the right, agree=0.775, adj=0.403, (0
split)
wine$Alcalinity.of.ash
< 17.45 to the left, agree=0.770, adj=0.388, (0 split)
wine$OD280.OD315.of.diluted.wines < 3.305 to the right, agree=0.725,
adj=0.269, (0 split)
Node
number 2: 67 observations, complexity param=0.05607477
predicted class=1 expected loss=0.1492537 P(node) =0.3764045
class counts: 57 4 6
probabilities: 0.851 0.060 0.090
left son=4 (59 obs) right son=5 (8 obs)
Primary splits:
wine$Flavanoids
< 2.165 to the right, improve=10.866940, (0 missing)
wine$Total.phenols
< 2.05 to the right, improve=10.317060, (0 missing)
wine$OD280.OD315.of.diluted.wines < 2.49 to the right,
improve=10.317060, (0 missing)
wine$Hue
< 0.865 to the right, improve= 8.550391, (0 missing)
wine$Alcohol
< 13.02 to the right, improve= 5.273716, (0 missing)
Surrogate splits:
wine$Total.phenols
< 2.05 to the right, agree=0.985, adj=0.875, (0
split)
wine$OD280.OD315.of.diluted.wines < 2.49 to the right, agree=0.985,
adj=0.875, (0 split)
wine$Hue
< 0.78 to the right, agree=0.970, adj=0.750, (0 split)
wine$Alcohol
< 12.46 to the right, agree=0.940, adj=0.500, (0 split)
wine$Proanthocyanins
< 1.195 to the right, agree=0.925, adj=0.375, (0 split)
Node
number 3: 111 observations, complexity param=0.317757
predicted class=2 expected loss=0.3963964 P(node) =0.6235955
class counts: 2 67 42
probabilities: 0.018 0.604 0.378
left son=6 (65 obs) right son=7 (46 obs)
Primary splits:
wine$OD280.OD315.of.diluted.wines < 2.115 to the right,
improve=36.56508, (0 missing)
wine$Color.intensity
< 4.85 to the left, improve=36.17922, (0 missing)
wine$Flavanoids
< 1.235 to the right, improve=34.53661, (0 missing)
wine$Hue
< 0.785 to the right, improve=28.24602, (0 missing)
wine$Alcohol
< 12.745 to the left, improve=23.14780, (0 missing)
Surrogate splits:
wine$Flavanoids < 1.48 to the right,
agree=0.910, adj=0.783, (0 split)
wine$Color.intensity < 4.74 to the left, agree=0.901, adj=0.761, (0
split)
wine$Hue
< 0.785 to the right, agree=0.829, adj=0.587, (0 split)
wine$Alcohol < 12.525
to the left, agree=0.802, adj=0.522, (0 split)
wine$Proanthocyanins < 1.285 to the right, agree=0.775, adj=0.457, (0
split)
Node
number 4: 59 observations
predicted class=1 expected loss=0.03389831 P(node) =0.3314607
class counts: 57 2 0
probabilities: 0.966 0.034 0.000
Node
number 5: 8 observations
predicted class=3 expected loss=0.25 P(node) =0.04494382
class counts: 0 2 6
probabilities: 0.000 0.250 0.750
Node
number 6: 65 observations
predicted class=2 expected loss=0.06153846 P(node) =0.3651685
class counts: 2 61 2
probabilities: 0.031 0.938 0.031
Node
number 7: 46 observations, complexity param=0.02803738
predicted class=3 expected loss=0.1304348 P(node) =0.258427
class counts: 0 6 40
probabilities: 0.000 0.130 0.870
left son=14 (7 obs) right son=15 (39 obs)
Primary splits:
wine$Hue
< 0.9 to the right, improve=5.628922, (0 missing)
wine$Malic.acid < 1.6 to the left,
improve=4.737414, (0 missing)
wine$Color.intensity < 4.85 to the left, improve=4.044392, (0
missing)
wine$Proanthocyanins < 0.705 to the left, improve=3.211339, (0
missing)
wine$Flavanoids < 1.29 to the right,
improve=2.645309, (0 missing)
Surrogate splits:
wine$Alcalinity.of.ash < 17.25 to the left, agree=0.935, adj=0.571,
(0 split)
wine$Color.intensity < 3.56 to the left, agree=0.935,
adj=0.571, (0 split)
wine$Malic.acid < 1.17 to
the left, agree=0.913, adj=0.429, (0 split)
wine$Proanthocyanins < 0.485 to the left, agree=0.913,
adj=0.429, (0 split)
wine$Ash < 2.06 to
the left, agree=0.891, adj=0.286, (0 split)
Node
number 14: 7 observations
predicted class=2 expected loss=0.2857143 P(node) =0.03932584
class counts: 0 5 2
probabilities: 0.000 0.714 0.286
Node
number 15: 39 observations
predicted class=3 expected loss=0.02564103 P(node) =0.2191011
class counts: 0 1 38
probabilities: 0.000 0.026 0.974
This
output provides the details of how rpart( ) selects the attribute and
value at each split point [nodes 1, 2, 3, and 7]. Node 1 is the root
node. Note that the split criterion used by rpart are different than the
split criterion produced by C5.0. This difference is due to the
different splitting algorithm [information entropy versus GINI] used by
each method. As stated with the regression classification of the iris
dataset, the node numbering is not completely sequential and is an
unusual behavior of rpart( ) and, if this regression tree went deeper,
the node numbers would increase by jumps at each deeper level.
A
text version of the tree is displayed using the command:
print(winerTree)
# view a text version of the tree
n=
178
node),
split, n, loss, yval, (yprob)
* denotes terminal node
1)
root 178 107 2 (0.33146067 0.39887640 0.26966292)
2) wine$Proline>=755 67 10 1 (0.85074627 0.05970149 0.08955224)
4) wine$Flavanoids>=2.165 59 2 1 (0.96610169 0.03389831 0.00000000)
*
5) wine$Flavanoids< 2.165 8 2 3 (0.00000000 0.25000000 0.75000000)
*
3) wine$Proline< 755 111 44 2 (0.01801802 0.60360360 0.37837838)
6) wine$OD280.OD315.of.diluted.wines>=2.115 65 4 2 (0.03076923
0.93846154 0.03076923) *
7) wine$OD280.OD315.of.diluted.wines< 2.115 46 6 3 (0.00000000
0.13043478 0.86956522)
14) wine$Hue>=0.9 7 2 2 (0.00000000 0.71428571 0.28571429) *
15) wine$Hue< 0.9 39 1 3 (0.00000000 0.02564103 0.97435897) *
Several
points are worth noticing in this regression tree. Only four of the
thirteen attributes are used in splitting the data into classes.
Additionally, while the goal is to classify the data into each of three
classes, the regression tree uses five leaf nodes to accomplish this
task. This result is an indicator that there are no definite class
boundaries in this data. This differs from the definite boundary in the
iris dataset between the Setosa class and the rest of the data.
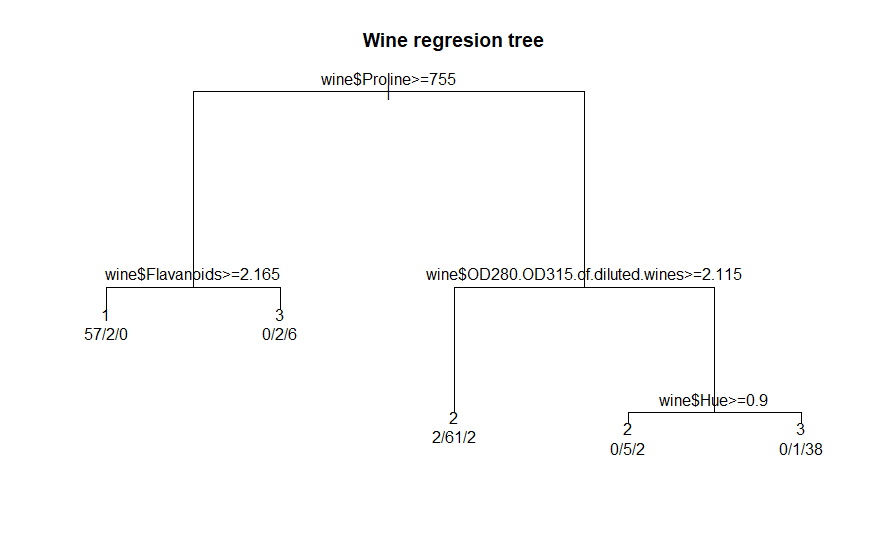
Here
is the output from the plot( ) function included in the rpart
package:
par(xpd
= TRUE) # define graphic parameter
plot(winerTree,
main = 'Wine regresion tree') # plot the tree
text(winerTree,
use.n = TRUE) # add text labels to tree
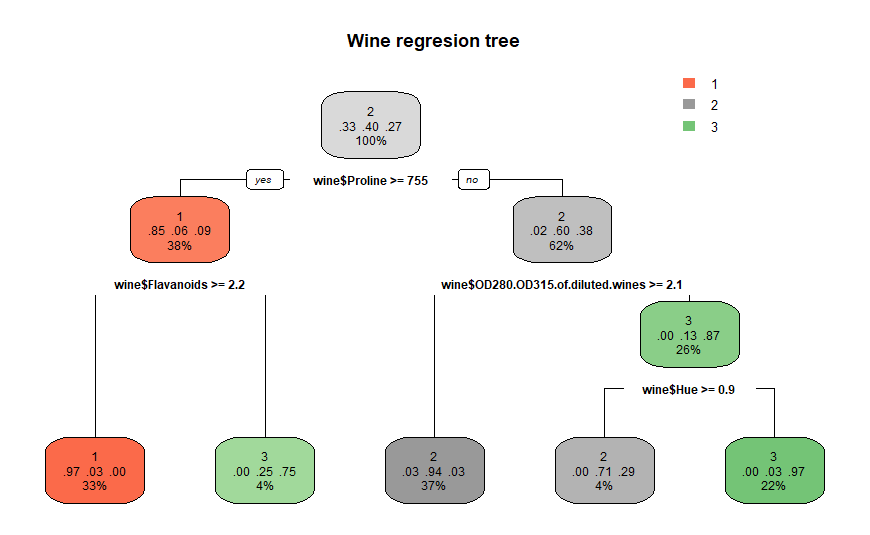
Here is the same wine regression
tree using rpart.plot( ):
rpart.plot(winerTree,
main = 'Wine regresion tree') # a better tree plot
The
third example of rpart decision tree classification uses the Titanic
dataset. Remember, that this dataset consists of 2201 rows and four
categorical attributes [Class, Age, Sex, and Survived].
f
= tn$Survived ~ tn$Class + tn$Age + tn$Sex # declare the regression
formula
tnrTree
= rpart(f, method = 'class') # train the tree
The
first command defines the regression formula f. The Class, Age, and Sex
attributes are used in the regression formula to predict the Survived attribute.
The second command trains a regression classification tree using the
formula f. The third command prints out the summary of the regression
tree object. Here is the output from summary(tnrTree).
Call:
rpart(formula
= f, method = "class")
n= 2201
CP nsplit rel error
xerror xstd
1
0.30661041 0 1.0000000 1.0000000 0.03085662
2
0.02250352 1 0.6933896 0.6933896
0.02750982
3
0.01125176 2 0.6708861 0.6863572
0.02741000
4
0.01000000 4 0.6483826 0.6765120
0.02726824
Variable
importance
tn$Sex tn$Class tn$Age
73 23
4
Node
number 1: 2201 observations, complexity param=0.3066104
predicted class=No expected loss=0.323035 P(node) =1
class counts: 1490 711
probabilities: 0.677 0.323
left son=2 (1731 obs) right son=3 (470 obs)
Primary splits:
tn$Sex splits as RL, improve=199.821600, (0
missing)
tn$Class splits as LRRL, improve= 69.684100, (0 missing)
tn$Age splits as LR, improve= 9.165241, (0
missing)
Node
number 2: 1731 observations, complexity param=0.01125176
predicted class=No expected loss=0.2120162 P(node) =0.7864607
class counts: 1364 367
probabilities: 0.788 0.212
left son=4 (1667 obs) right son=5 (64 obs)
Primary splits:
tn$Age splits as LR, improve=7.726764, (0
missing)
tn$Class splits as LRLL, improve=7.046106, (0 missing)
Node
number 3: 470 observations, complexity param=0.02250352
predicted class=Yes expected loss=0.2680851 P(node) =0.2135393
class counts: 126 344
probabilities: 0.268 0.732
left son=6 (196 obs) right son=7 (274 obs)
Primary splits:
tn$Class splits as RRRL, improve=50.015320, (0 missing)
tn$Age splits as RL, improve= 1.197586, (0
missing)
Surrogate splits:
tn$Age splits as RL, agree=0.619, adj=0.087, (0 split)
Node
number 4: 1667 observations
predicted class=No expected loss=0.2027594 P(node) =0.757383
class counts: 1329 338
probabilities: 0.797 0.203
Node
number 5: 64 observations, complexity param=0.01125176
predicted class=No expected loss=0.453125 P(node) =0.02907769
class counts: 35 29
probabilities: 0.547 0.453
left son=10 (48 obs) right son=11 (16 obs)
Primary splits:
tn$Class splits as -RRL, improve=12.76042, (0 missing)
Node
number 6: 196 observations
predicted class=No expected loss=0.4591837 P(node) =0.08905043
class counts: 106 90
probabilities: 0.541 0.459
Node
number 7: 274 observations
predicted class=Yes expected loss=0.0729927 P(node) =0.1244889
class counts: 20 254
probabilities: 0.073 0.927
Node
number 10: 48 observations
predicted class=No expected loss=0.2708333 P(node) =0.02180827
class counts: 35 13
probabilities: 0.729 0.271
Node
number 11: 16 observations
predicted class=Yes expected loss=0 P(node) =0.007269423
class counts: 0 16
probabilities: 0.000 1.000
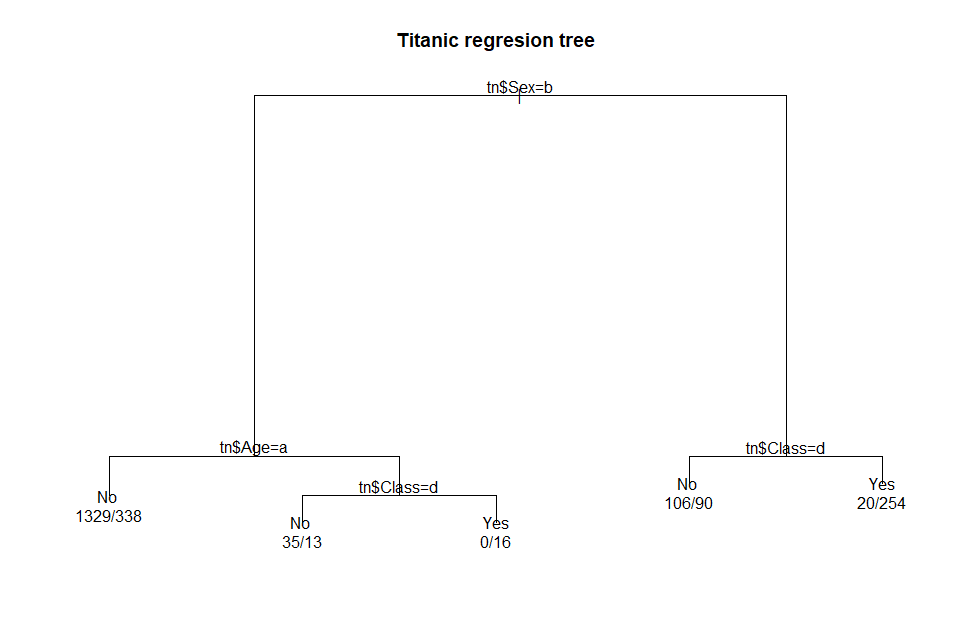
Here is the output from the plot( )
function included in the rpart package:.
par(xpd
= TRUE) # define graphic parameter
plot(tnrTree,
main = 'Titanic regresion tree') # plot the tree
text(tnrTree,
use.n = TRUE) # add text labels to tree
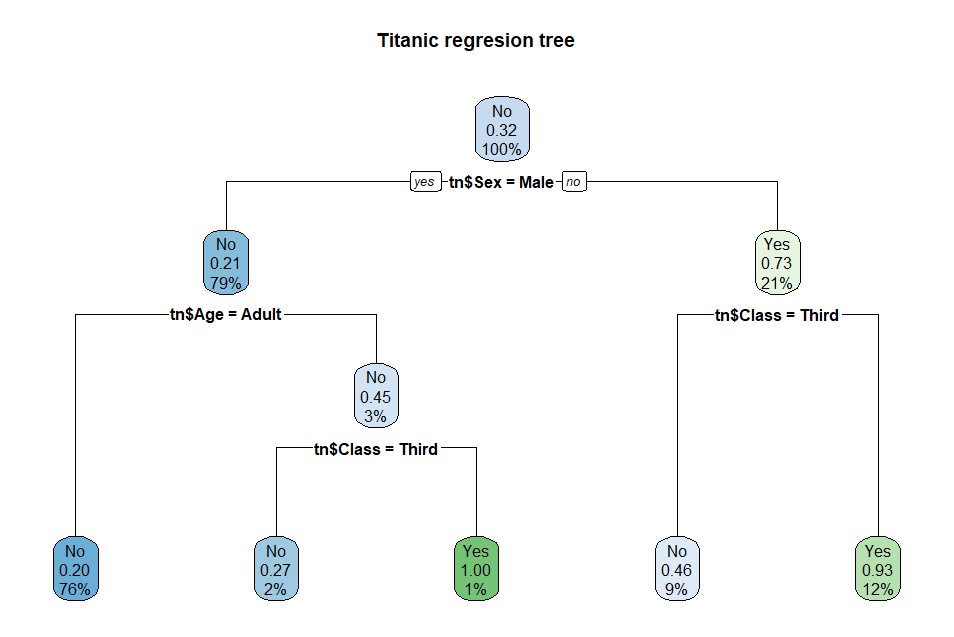
Here is the same titanic
regression tree using rpart.plot( ):
rpart.plot(tnrTree,
main = 'Titanic regresion tree') # a better tree plot
This concludes the classification
exercise using C5.0 and rpart. Hopefully, this can help you set
up a classification model with either of these methods.
